

UTM Fraud Detection: 4 Signal Groups for Marketing Analysts


Last updated on October 12, 2026 · 19 min read
UTM fraud detection means finding invalid or anonymized visits hiding behind UTM-tagged campaign traffic by joining campaign labels with device, network, behavior and conversion signals. The first move for any analyst is operational: compute a campaign-level decision rate and high-risk share, then quarantine any UTM label that looks anomalous until you've sampled and reviewed it.
TL;DR:
- Keep GA4 campaign fields at user, session, and event scopes; flattening them early hides when traffic quality changed and weakens later investigations.
- Join device and network indicators with behavior, especially visits under two seconds, absent expected interactions, and repeated sessions sharing a fingerprint.
- Compare campaign decision rates with the property baseline; low coverage does not mean clean traffic, and risk shares several times above baseline merit review.
- Before excluding traffic, quarantine flagged UTM labels and manually review stratified session samples; document thresholds, sample sizes, and false positive estimates for budget decisions.
- Compare revenue per decisioned user and retention with organic or another baseline; top line conversions can hide campaigns that deliver no durable customers.
Table of Contents
- Why UTM labels don't equal traffic quality
- Signals to join with UTM traffic
- Operational detection approach: confidence bands, decision rate, and triage
- GA4 and BigQuery checks to spot UTM fraud quickly
- What a detection layer like ShieldLabs contributes to this workflow
- Overview of UTM parameter manipulation tactics commonly used in fraud
- Integration of UTM fraud detection with broader fraud prevention frameworks and tools
- Understanding the impact of UTM fraud on marketing ROI and campaign performance
- Case studies or examples illustrating successful UTM fraud detection and mitigation
- Advanced AI and machine learning techniques for enhancing UTM fraud detection accuracy
- Analyst-to-marketer checklist: what to report and recommended next steps
- How ShieldLabs fits as an operational signal provider for UTM fraud detection
- FAQ
- Sources
Why UTM labels don't equal traffic quality
UTM parameters record where a visit claims to come from. Source, medium, campaign and content fields answer "what was clicked," never "was this a real person acting with intent." That gap is where fraud hides, and it's why attribution data alone can't carry the weight marketing teams put on it.
Before any filtering or attribution modeling happens, campaign fields need to survive at three scopes: user, session and event. GA4's own documentation lays out campaign_source, campaign_medium, campaign_name, campaign_term and campaign_content, and recommends keeping first-user, session and event-level traffic_source fields intact for analysis. Flatten them too early and you lose the ability to ask when traffic quality degraded.
The MRC's Invalid Traffic Detection and Filtration Standards Addendum treats attribution and invalid traffic detection as separate disciplines entirely. That distinction matters for how you structure the work:
- Attribution answers which campaign gets credit for a conversion.
- Invalid traffic detection answers whether the underlying visit was legitimate at all.
- Both tracks need to run in parallel, not as a single combined check.
Signals to join with UTM traffic
Campaign labels become useful once you pair them with signals that describe the visit itself rather than its claimed origin. Four categories do most of the work.
Device and browser indicators catch the visits that never looked human to begin with: missing JavaScript execution, automation markers, and anti-detect browser detection flags that suggest a session was built to evade normal tracking. Network signals add context: datacenter IP ranges, proxy or VPN presence, Tor exit nodes, rapid IP churn across a single session, and ASNs that don't match the audience a campaign targets.
Behavioral signals tend to be the most revealing because they're hardest to fake at scale:
- Dwell times under one or two seconds across an entire campaign's sessions.
- Zero mouse movement or touch events on a device type that should generate them.
- Repeated short sessions from the same fingerprint hitting the same landing page.
- High bounce rates paired with no scroll, no secondary page view and no conversion intent.
Attribution coverage itself is a signal. When a meaningful share of sessions in a campaign return no usable detection data, that's a decision rate problem, not a clean bill of health. The MRC's 2024 IVT interim updates formalize decision-rate disclosure as a requirement precisely because low-decision campaigns can mask sophisticated invalid traffic.
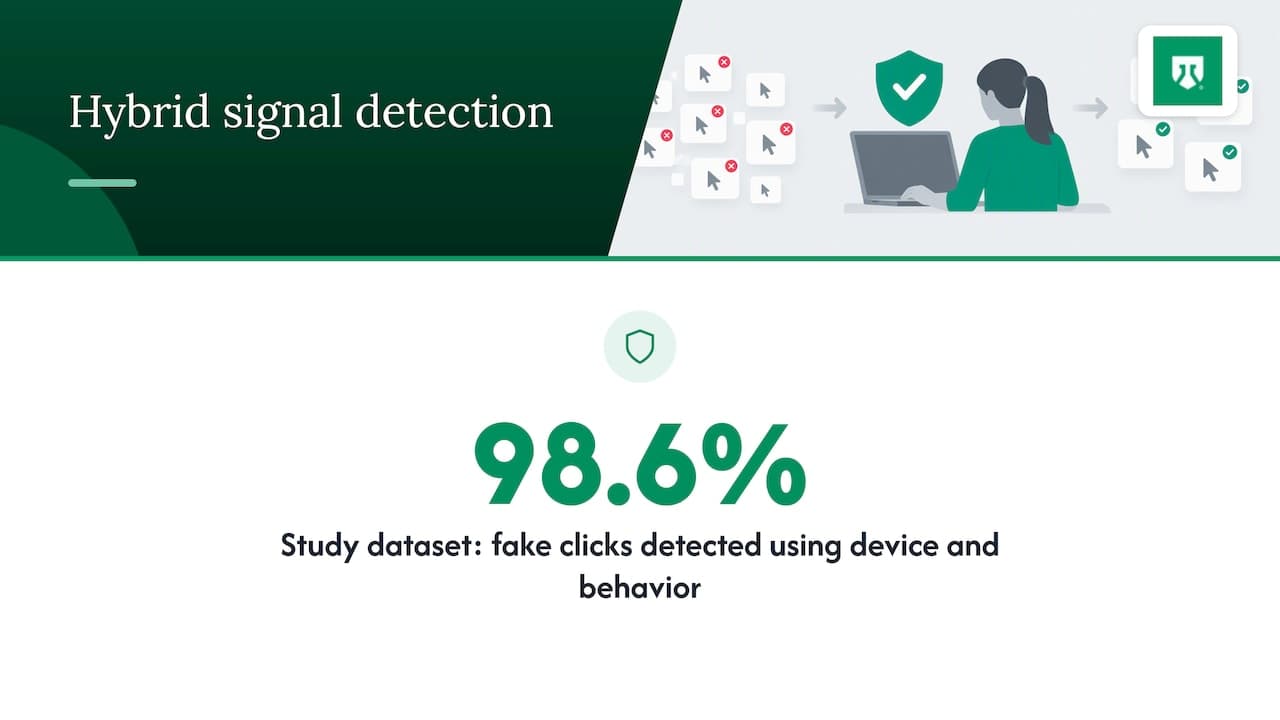
A peer-reviewed hybrid detection study reported a very high detection rate of fake clicks when combining device fingerprints with behavioral patterns in its own dataset. The authors are explicit that this is a dataset-specific result, not a production guarantee, but it supports the case for combining fingerprint and behavior signals rather than relying on either alone.
Finally, conversion-quality metrics close the loop: revenue per decisioned user, retention at 30 and 60 days, and downstream events like repeat purchase or account creation. A campaign that passes every upstream check but produces no durable customers still deserves scrutiny.
Operational detection approach: confidence bands, decision rate, and triage
Fraud detection is probabilistic, not binary. Treat every flagged session as a confidence estimate, not a verdict, and build your workflow around sampling rather than absolute claims.
Start by measuring a decision rate per campaign: the percentage of visits where your detection tooling returned sufficient signal to make a call. A low decision rate doesn't mean traffic is clean. It usually means sophisticated invalid traffic is suppressing the signals your tools depend on, which is exactly the blind spot the MRC addendum warns about.
From there, a repeatable triage sequence keeps the process defensible:
- Alert on campaigns where decision rate or high-risk share crosses a threshold you've set in advance.
- Pull a stratified sample of flagged sessions, not just the worst outliers.
- Quarantine the UTM label from active reporting while the sample is under review.
- Validate manually, checking device, network and behavioral evidence against the flag.
- Lift the quarantine or confirm the exclusion, and log the outcome either way.
Pro Tip: Document the threshold, the sample size and the reviewer's notes for every quarantine decision. Six months later, that record is what turns a budget conversation into evidence instead of argument.
Our guidance on reducing false positives while keeping coverage walks through how to size thresholds so you're not quarantining legitimate campaigns alongside the fraudulent ones.
GA4 and BigQuery checks to spot UTM fraud quickly
Once campaign fields are preserved at the right scopes, a handful of checks surface most of the problem traffic without custom tooling.
Campaign decision rate is the first pass: sessions where your detection layer returned usable signals, divided by total sessions for that campaign. The BigQuery export schema exposes first-user traffic_source fields, session_traffic_source_last_click and event-level traffic_source fields, which makes this a straightforward join against your detection vendor's output.
Campaign risk share follows naturally: the percentage of sessions in a high-risk or flagged band for a given campaign, compared against the property-wide baseline. A campaign running at three or four times the baseline risk share deserves a sample review before the next budget cycle.
Behavioral anomaly checks round out the picture. Pull the distribution of dwell time, mouse or touch events, and pages per session, broken out by campaign content value rather than just campaign name. Fraud often concentrates in specific ad creatives or landing page variants rather than spreading evenly across a campaign.
A simple way to organize the first pass across campaigns:
| Check | What it measures | Flag threshold to review |
|---|---|---|
| Decision rate | Share of sessions with usable detection signals | Materially below the property average |
| Risk share | Share of sessions in a high-risk or flagged band | Several times the property baseline |
| Dwell time distribution | Spread of session duration by campaign content | Heavy concentration under one to two seconds |
| Conversion-quality delta | Revenue per decisioned user vs. baseline channels | Meaningfully below organic or direct traffic |
Conversion-quality delta compares revenue per decisioned user and retention for a given campaign against organic or another baseline channel, which the Google Analytics Data API conversions documentation supports by letting you contrast DATA_DRIVEN and LAST_CLICK attribution models for the same traffic.
Before any automated exclusion goes live, sample and review manually. Stratify the sample across campaign labels and risk bands rather than pulling only the worst sessions, and review enough volume per flagged campaign to produce a defensible false-positive estimate for the people who approve budget decisions.
What a detection layer like ShieldLabs contributes to this workflow
The checks above depend on having per-visit signal to join against campaign labels in the first place. That's the layer we supply.
Our platform scores every visit against more than 100 signals spanning VPNs, proxies, Tor, Apple Private Relay, datacenter ranges, anti-detect browser detection and automation markers, using a mix of deterministic rules and AI, as explained in our detailed log file SEO to spot GPTBot and CDN blind spots guide. Identification persists across visits, so a returning session is recognized with up to 99% accuracy even after cookies are cleared, incognito mode is used or IP addresses rotate.
What that means for the checks in this playbook:
- Per-visit and property-wide risk scoring, broken down by traffic source and campaign, which gives you decision rate and risk share without building the join yourself.
- Every score ships with the signals that produced it, so an analyst can see exactly why a session was flagged rather than trusting a single opaque number.
- A lightweight JavaScript snippet and server-side SDKs let you export scores alongside your GA4 BigQuery data, so campaign decision rate and risk share calculations run against the same dataset.
- Network intelligence covering datacenter IPs, residential proxies and unusual ASNs, feeding directly into the network-signal checks described earlier.
The explainability matters most during triage. When a flagged session comes with its contributing signals attached, reviewers can rule out benign edge cases, like internal QA traffic or scheduled monitoring, before escalating to a campaign-level exclusion.
Overview of UTM parameter manipulation tactics commonly used in fraud
UTM fields are plain text, which makes them trivial to forge. Several patterns show up repeatedly across campaigns that later turn out to carry invalid traffic.
Parameter spoofing is the simplest: copying a legitimate campaign's UTM string onto a link that drives traffic through a bot network or click farm, so the invalid visits inherit the attribution of a real, paid campaign. This inflates reported performance for a campaign that never actually ran the traffic it's credited with.
Parameter stuffing or rotation cycles through dozens of campaign or content values rapidly, often automated, to spread invalid sessions thin enough that no single UTM combination crosses a volume threshold that would trigger review. Each individual label looks small; the aggregate traffic is substantial.
Click injection and click spamming fire UTM-tagged clicks without any real user interaction, usually to claim attribution credit on a conversion that would have happened anyway through another channel. Our playbook on catching click spamming covers the specific detection checks for this pattern in more depth.
Referrer and campaign field mismatches are another tell: a session tagged with a paid social UTM but a referrer header, device profile or network signature that's inconsistent with that platform's typical traffic. The IAB's click-measurement guidelines recognize that some invalid clicks are fundamentally unknowable from the click record alone, which is exactly why pattern analysis across many sessions beats inspecting individual clicks one at a time.
Integration of UTM fraud detection with broader fraud prevention frameworks and tools
UTM fraud detection works best as one input into a wider fraud prevention setup rather than a standalone check run in isolation.
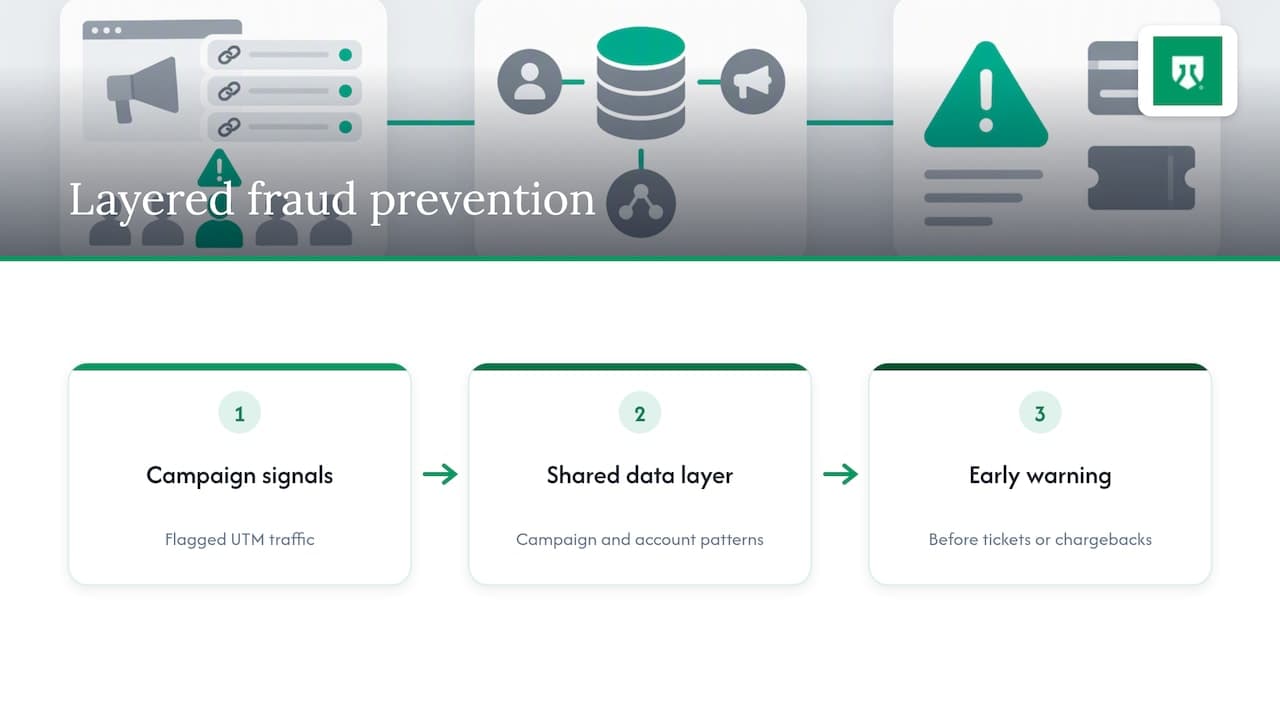
Account-level fraud signals and campaign-level traffic signals answer different questions, but they reinforce each other. A campaign with a high anonymized-traffic share often correlates with downstream account abuse: free-trial abuse, referral fraud or multi-accounting traced back to the same acquisition source. When traffic quality analytics and account-level pattern detection share a data layer, a spike in flagged UTM traffic becomes an early warning for abuse that would otherwise surface weeks later in support tickets or chargebacks.
Our pattern detection features surface exactly this kind of cross-account signal: multi-accounting, account sharing and account farms operating behind a single connection, computed from the same visitor identification layer that scores campaign traffic. Feeding campaign-level risk share into the same dashboard as account abuse patterns lets a growth team see whether a paid channel is driving real signups or just inflating top-of-funnel numbers.
Server-side integration keeps this practical. Because our SDKs cover Node.js, Python, Go and PHP alongside an OpenAPI specification, risk scores can sit in the same pipeline as existing fraud rules, payment risk checks or account-takeover monitoring rather than requiring a separate system to reconcile.
The MRC's own framing supports this layered approach: the 2024 IVT interim updates explicitly encourage combining decision-rate reporting with device and parameter-based fingerprinting rather than treating either as sufficient alone.
Understanding the impact of UTM fraud on marketing ROI and campaign performance
Invalid traffic behind UTM tags distorts the numbers marketing teams use to make budget decisions, and the distortion compounds the longer it goes unchecked.
Cost per acquisition looks artificially low when a campaign's reported conversions include sessions that never represented a real prospect. Budget then shifts toward the channel that appears most efficient, which is often the channel with the highest share of invalid traffic rather than the highest quality audience. The MRC addendum separates general invalid traffic from sophisticated invalid traffic precisely because the sophisticated kind is built to survive exactly this kind of surface-level performance review.
Attribution models compound the problem. Comparing data-driven and last-click models for the same campaign, as the Google Analytics Data API documentation recommends, often reveals that a channel's credited conversions shift substantially between models, which is itself a signal worth investigating alongside decision rate and risk share.
The clearest long-term cost shows up in retention and revenue per decisioned user rather than in the top-line conversion count. A campaign that converts well on paper but produces customers who churn immediately, or accounts that never engage past signup, is often one where UTM fraud inflated the funnel without ever delivering a durable customer. Measuring revenue per decisioned user against a baseline channel, as described earlier in the GA4 and BigQuery checks, is the most direct way to see this gap before a full budget cycle has been spent on it.
Case studies or examples illustrating successful UTM fraud detection and mitigation
Published case studies specific to UTM-tagged campaign fraud are limited, so the clearest evidence comes from controlled research and from the detection techniques it validates rather than from named production deployments.
The hybrid detection study referenced earlier offers the most concrete illustration available: combining device fingerprints with behavioral patterns detected roughly 98.6% of fake clicks in its experimental dataset. The mitigation approach that followed from that result mirrors the triage workflow described in this playbook: flag sessions on combined fingerprint and behavior criteria, then validate before taking any traffic-level action, since the authors themselves note the figure is specific to their test conditions rather than a universal detection rate.
The practical lesson from that research, and from the MRC's decision-rate reporting requirement, is that successful mitigation rarely comes from a single rule catching fraud outright. It comes from stacking several independent signals, device, network, behavioral and attribution coverage, so that a session has to evade all of them simultaneously to pass as clean. Teams that run the sampling and quarantine workflow consistently, documenting thresholds and review outcomes as described earlier, build the evidence base needed to defend an exclusion decision to stakeholders without overclaiming certainty the underlying data doesn't support.
Advanced AI and machine learning techniques for enhancing UTM fraud detection accuracy
Machine learning adds the most value where rule-based checks run out of room: combining dozens of weak signals into a single risk estimate rather than relying on any one threshold.
Deterministic rules remain useful for clear-cut cases, a known datacenter IP range or a confirmed automation marker, but AI models trained on combined device, network and behavioral features can surface patterns that no single rule would catch alone, like a cluster of sessions that each look individually plausible but share subtle fingerprint similarities. Our own scoring approach combines deterministic rules with AI across more than 100 signals per visit for this reason: some anonymity techniques are identifiable with certainty, while others only become visible as a pattern across many visits.
The hybrid detection research cited earlier is itself an example of this combined approach, pairing fingerprint matching with behavioral modeling rather than using either technique in isolation. That pairing is consistent with where the field is heading: fewer single-signal rules, more models that weigh many signals together and output a confidence score an analyst can review rather than a binary pass or fail.
The caveat that matters for marketing teams: a model's accuracy on a research dataset doesn't transfer automatically to production traffic. Decision-rate reporting, confidence bands and manual sampling remain necessary even with AI-driven scoring in place, because the goal isn't a model that claims certainty, it's a model that produces a defensible estimate your team can act on and audit later.
Analyst-to-marketer checklist: what to report and recommended next steps
The deliverable that gets budget decisions approved is narrower than most analysts expect. Stakeholders need four numbers and a clear statement of uncertainty, not a full technical writeup.
- Campaign decision rate, so stakeholders understand how much of the traffic actually had enough signal to evaluate.
- High-risk share per campaign against the property baseline.
- Revenue per decisioned user, compared to organic or another baseline channel.
- A sampled false-positive rate from manual review, not an assumed zero.
Recommendations should stay proportional to the evidence: quarantine the specific UTM labels that triggered the flags, instrument landing pages for stronger behavioral signal where decision rates are low, and run an A/B test that measures the actual lift from excluding flagged traffic before making the exclusion permanent.
Present confidence bands and the sample size behind them rather than an absolute claim. "We reviewed 300 sessions and estimate a 4 to 7 percent false-positive rate" holds up in a budget meeting. "This campaign is fraudulent" invites a challenge that evidence this probabilistic can't always survive.
How ShieldLabs fits as an operational signal provider for UTM fraud detection
Everything in this playbook depends on having reliable per-visit signal to join against campaign labels, and that's the gap we're built to close. Our platform scores each visit across anonymity, device and network signals, then rolls those scores up into campaign-level risk share and traffic quality breakdowns that map directly onto the decision rate and risk share checks covered earlier.
- Every score arrives with the signals behind it, so your team can audit a flag before excluding a campaign.
- Self-serve signup and published pricing mean a test campaign can be instrumented in about five minutes, without a sales call.
- A free tier is available and provides enough to validate the decision rate and risk share approach against one or two real campaigns before committing budget.
A practical next step: instrument a single test campaign, run it for a reporting cycle, then compare its decision rate and conversion-quality delta before and after you start acting on the flags. Our pricing page lists the Starter, Growth and Scale plans alongside the free tier if the test campaign shows enough flagged volume to justify scaling the check across your full account.
FAQ
What is UTM fraud detection?
UTM fraud detection is the process of finding invalid or anonymized visits hiding behind UTM-tagged campaign traffic by joining campaign labels with device, network, behavioral and conversion signals. It treats attribution and traffic validity as two separate questions, since a session can carry a legitimate-looking UTM tag while still failing every quality check behind it.
How is UTM fraud different from general ad fraud?
UTM fraud specifically targets the campaign tagging layer: source, medium, campaign and content parameters that marketing platforms use for attribution. Broader ad fraud frameworks also cover impression fraud, affiliate fraud and payment fraud, but UTM-specific detection focuses on validating the traffic behind a specific tagged link using the GA4 and BigQuery attribution fields available to most marketing teams.
What decision rate should a healthy campaign have?
There's no universal decision rate every campaign should hit, since it depends on traffic mix and detection coverage. The relevant benchmark is the property's own baseline: a campaign with a decision rate materially below that baseline, per the MRC's decision-rate reporting guidance, warrants a sample review before any budget decision.
Can machine learning fully automate UTM fraud detection?
Machine learning models can combine many weak signals into a stronger risk estimate, and hybrid fingerprint and behavioral approaches have shown strong detection rates in controlled research. Production traffic still requires sampling, confidence bands and manual review, since a model's accuracy on a research dataset doesn't automatically carry over to a live campaign.
Does ShieldLabs block fraudulent UTM traffic automatically?
Our platform scores each visit and surfaces the anonymity, device and network signals behind that score, including campaign-level risk share your team can use for the checks in this playbook. The signals your team uses to block or exclude traffic, and the threshold for doing so, stay in your own code and reporting workflow.
Sources
- Invalid Traffic Detection and Filtration Standards Addendum
- Configuration | Google Analytics | Google for Developers
- Hybrid detection study (2021)
Recommended
Related articles
Fraud Prevention Strategies for Web Apps
Practical fraud prevention strategies for web apps, from signup and login to offers and checkout. Match controls to the abuse at each step.


Web Device Binding: Coarse Fingerprints Link Visits for Fraud Teams
Learn how web device binding helps fraud teams recognize visitors with coarse fingerprints while managing privacy, latency, drift, and false positives.
Remember This Device for MFA With a Persistent Device ID
Design remember this device for MFA with a revocable trust credential, persistent device context, expiry and step-up authentication for sensitive actions.
