

Traffic Quality Analysis: 5 Checks Marketers Run Before Cutting Spend

Last updated on October 17, 2026 · 17 min read
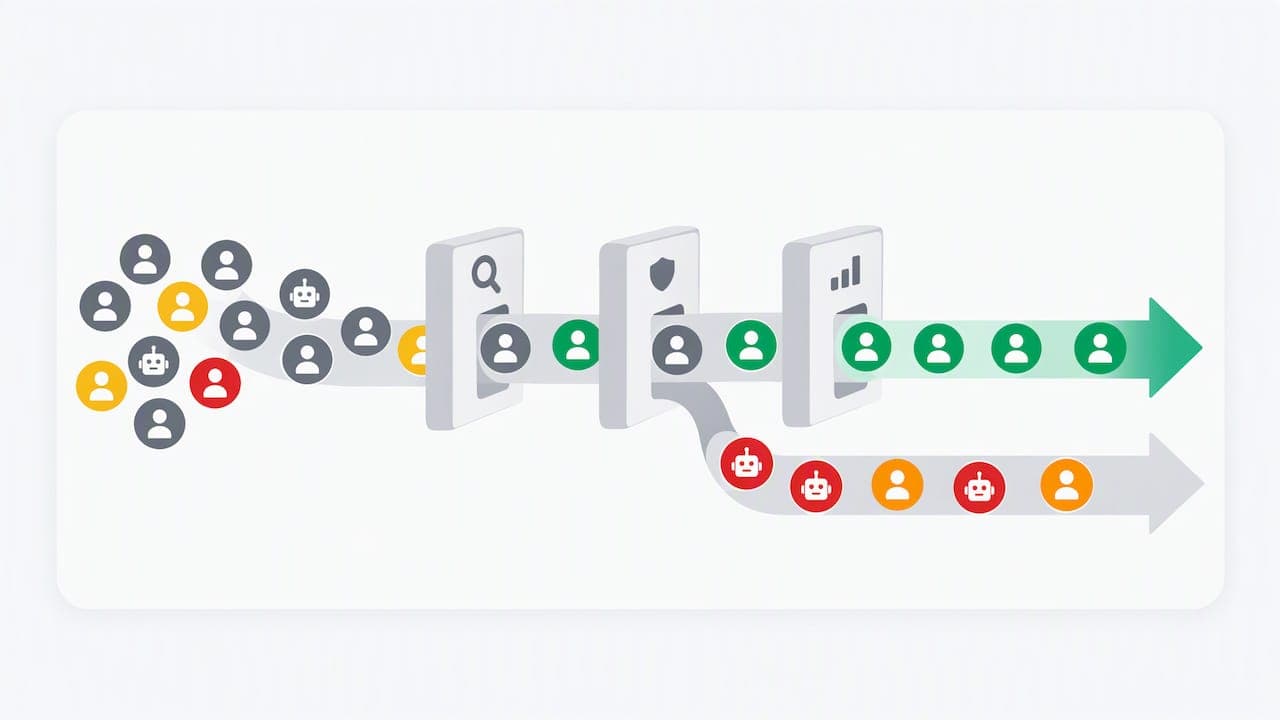
Traffic quality analysis is the practice of judging whether your visitors are real, relevant and likely to act, and the first signals to pull are engagement, conversion and signs of invalid traffic. Start with session depth and funnel conversion by channel, then screen for non-human activity. Industry guidance from IAB and MRC sets the baseline, and we describe how a signal layer like ours fits in.
TL;DR:
- Tag campaigns with UTM parameters, then compare engagement and funnel conversions by channel, landing page, and creative; missing tags can send visits into direct traffic.
- Flag impossible timing, repeated device fingerprints, event bursts, and spoofed referrers, but treat a shared IP alone as weak evidence because households share connections.
- Separate risk bands before averaging: healthy conversion among clean visits points to noisy measurement, while weak clean traffic implicates the offer or landing page.
- Rank costly, low quality sources first, test one change at a time, and monitor paid channels weekly and other channels monthly.
Table of Contents
- Which metrics tell you whether traffic is any good?
- How do you analyze traffic by source and campaign?
- What are the signs of invalid and fraudulent traffic?
- Which standards and tools can you trust?
- What is a repeatable workflow for a traffic quality audit?
- How should you act on what you find?
- How does anonymized traffic distort your quality metrics?
- How do you connect traffic quality analysis to real-time fraud detection?
- How can you correlate visitors across sessions despite incognito mode and cleared cookies?
- What do multi-accounting and account sharing look like in traffic reports?
- How do you set scoring thresholds that fit your risk tolerance?
- What do real traffic quality findings look like in practice?
- Why auditable signals matter more than a verdict
- Evaluate a signal layer built for traffic quality work
- FAQ
- Sources
Which metrics tell you whether traffic is any good?
Raw visits say little about quality. Begin with the metrics that reveal intent, and pull them per channel rather than for the whole site.
- Average session duration and pages per session: short, shallow sessions from a channel that should deliver readers point to mismatched intent or automation.
- Bounce or engagement rate: read it next to duration, because a one-page visit that ends in a form submit is a success.
- Conversion rate by funnel step: micro-conversions such as newsletter signups and macro-conversions such as purchases are the strongest quality signals you have.
- New versus returning visitors: a sudden spike in new visitors with no returns often marks low-intent or synthetic traffic.
- Device and geography splits: a campaign aimed at one region that suddenly delivers most sessions from another deserves a closer look.
Event-level data adds precision. Tie form submits and add-to-cart events back to the acquisition channel, so you can say which source produces action rather than clicks.
Google Analytics ships predefined traffic acquisition, user acquisition, pages and screens, and events reports, which are the quickest place to export these views, as the Google Analytics guide for marketers describes. Export key views such as sessions by channel, engagement per session, conversion rate by channel, new versus returning users, and device by country.
How do you analyze traffic by source and campaign?
Source analysis shows where quality is won or lost. Mailchimp's overview of website traffic sources lists the standard buckets: direct, referral, organic, social, paid, email and unknown. Compare engagement and conversion across all of them. A channel with high volume and weak conversion is a candidate for a cut, while a small channel with strong conversion deserves more budget.
Work through it in this order:
- Tag every campaign link with UTM parameters so sessions trace back to a campaign, not just a channel.
- Check how much traffic lands in "direct" or "unknown," since missing tags push campaign visits there.
- Break results down by landing page and creative.
- Flag combinations with strong click volume and weak on-site behavior.
- Add outside context when you need it.
On that last step, a traffic gap analysis or competitor benchmark helps you judge whether your growth is on par. Similarweb's guide to traffic analysis covers monthly visitors, engagement metrics, channel performance and new versus returning splits. For SEO-specific channel techniques, this practical guide to analyzing website traffic for SEO growth is a useful companion.
Look for these mismatches:
- High click-through on an ad whose landing page repeats none of its promise.
- Social referrals that arrive in bursts and leave in seconds.
- A referral domain you cannot find or recognize.
What are the signs of invalid and fraudulent traffic?
Invalid traffic, or IVT, is activity that does not come from a real person with genuine interest. The IAB and MRC addendum on IVT detection and filtration gives accredited measurers guidance on detecting and filtering invalid impressions, clicks and other digital media activity so measurement stays accurate. Common sources include bots, automation tools, datacenter IP ranges, proxies, Tor, Apple Private Relay and anti-detect browser setups.
Check these signals during an audit:
- Session timing that no human could produce, such as an implausibly rapid sequence of page views.
- The same device fingerprint appearing across many supposedly separate visitors.
- High-velocity events like repeated form submits from one connection.
- Referrers that are spoofed, empty or unrelated to your content.
- Geolocation that disagrees with billing or shipping details.
Multi-layered verification works better than any single check. Experts contributing to IAB guidelines recommend combining behavioral fingerprinting, bot filtration and real-time anomaly detection to keep reported metrics from being inflated by non-human activity. For a longer walkthrough, see our guide on how to detect invalid traffic.
Pro Tip: Triage by spend. A suspicious signal on a channel eating budget justifies an immediate pause, while the same signal on a tiny channel can wait for a deeper look.
Which standards and tools can you trust?
Standards give you a defensible baseline. The IAB and MRC attention measurement framework sets out methodological principles, transparency and validation expectations. The Attention Measurement Playbook for Marketers adds a practical point: attention complements viewability, and it belongs next to your other KPIs rather than standing alone.
Tools fall into three categories:
- Analytics platforms: predefined acquisition reports for your own sessions and events.
- Traffic intelligence: estimation and benchmarking, such as Ahrefs' traffic checker for competitor pages and keyword-driven insight.
- Signal-layer detection services: per-visit identification, risk scoring and the anonymity signals behind each score.
Attention data does not replace session engagement, it explains it. Use attention and viewability where you buy media, and session engagement where you own the experience. To validate any signal, cross-check it against a second source and audit a sample by hand. Google also documents how its ad systems combine reviewers, automatic filters and machine learning in its ad traffic quality overview, which is a useful reference when your paid numbers and your analytics disagree.
What is a repeatable workflow for a traffic quality audit?
Run the same sequence after every campaign, and on a schedule between campaigns.
- Baseline your key metrics and export acquisition data for the period.
- Segment by channel, landing page and campaign using UTMs and the prebuilt acquisition reports.
- Apply IVT and anomaly checks: velocity, device patterns, referrer hygiene.
- Flag and rank sources, then run small interventions such as pausing a placement, redirecting traffic or adjusting bids.
- Measure the impact and write down each decision so the audit trail is clear.
Pro Tip: Change one thing per source at a time. If you pause a placement and rewrite its landing page together, you cannot tell which move improved quality.
For a deeper procedural example, our article on traffic laundering detection walks through checks to run before billing decisions.
How should you act on what you find?
Rank problems by money at risk. Start with high spend and low quality, then medium-spend anomalies, then low-volume oddities. Typical actions include pausing a campaign, aligning creative with its landing page, tightening targeting or bids, and adding filtration rules.
- Verify improvement with a pre/post comparison or an A/B split.
- Keep a monitoring cadence, weekly for paid channels and monthly for the rest.
- Record what you changed so the next audit starts from facts.
| Action | Expected gain | Monitoring window |
|---|---|---|
| Pause a high-spend, low-quality placement | Immediate budget recovery | Review after the change |
| Align creative and landing page | Higher engagement per click | Review after the change |
| Add filtration rules for flagged sources | Cleaner conversion data | Review after the change |
| Review low-volume oddities | Early warning of new patterns | Monthly |
How does anonymized traffic distort your quality metrics?
Anonymized visits come through VPNs, proxies, Tor, Apple Private Relay and datacenter ranges, and they bend metrics in two directions. Some are harmless: a privacy-minded customer on a VPN converts like anyone else. Others are not: automation and abuse often hide behind the same layers. If you treat all anonymity as bad, you throw away real customers. If you ignore it, you let inflated sessions and fake signups pollute your averages.
The practical effect shows up in geography and channel reports. A channel that appears to deliver visitors from dozens of countries may in fact deliver one operator behind rotating exit points. Bounce rate and session duration for that channel then describe a script, not an audience, and your cost per acquisition looks better or worse than it truly is.
The fix is to split traffic by risk band before you read any average. Our traffic analytics breaks traffic into clean, low, medium and high risk bands and shows which channels, referrers and campaigns bring anonymized and high-risk visitors. Read engagement and conversion for the clean band separately from the rest, and you see what your real audience does. The Traffic Analytics documentation shows how that breakdown looks in the dashboard.
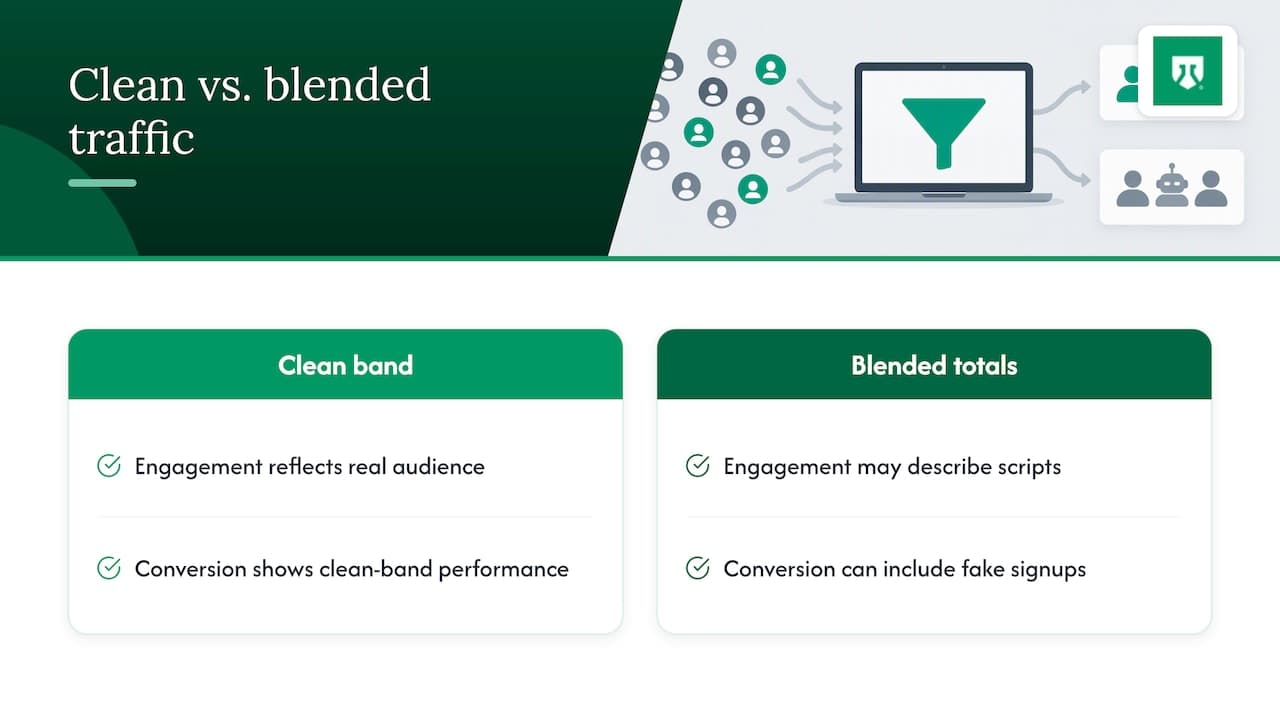
Then compare the two views. If conversion is healthy in the clean band but the blended number is poor, your channel is fine and your measurement is noisy. If even the clean band is weak, the problem is the offer or the landing page.
How do you connect traffic quality analysis to real-time fraud detection?
A periodic audit finds problems after the money is spent. Connecting analysis to a fraud detection system moves the check to the moment of the visit. Each visit is identified and scored on arrival.
The decision stays with you. Our platform returns a risk score and the signals behind it, and your own code decides what happens next: let the visit through, ask for step-up verification, or flag it for review. That separation keeps the verdict auditable, because you can see exactly which signals pushed a score up.
A sound integration usually includes:
- A client-side snippet collects the signals on each visit. Setup details are described in our visitor identification quick start.
- A server-side check reads the score before a sensitive action such as signup, checkout or a promo claim.
- A reporting layer tags sessions with their risk band so marketing can see quality by channel.
Start with logging only. Run the integration for a couple of weeks, compare scores with outcomes, and only then wire the score into decisions. For account-level follow-up once a pattern appears, our guide to fraud analytics shows how to investigate traffic and account risk together.
How can you correlate visitors across sessions despite incognito mode and cleared cookies?
Cookies are the weakest way to recognize a returning visitor. Clear them, open an incognito window or rotate your IP, and a cookie-based tool sees a stranger. Quality analysis built on that view overcounts unique visitors and misses repeat abusers.
Persistent identification works from a different base. Instead of relying on a stored token, it combines signals collected on each visit, interpreted by deterministic rules and AI. Our platform recognizes a returning visitor with up to 99% accuracy despite cleared cookies, incognito mode, IP rotation and months between visits.
For your analysis, that changes several readings:
- Unique visitor counts become closer to actual people.
- Return rates reflect real loyalty rather than cookie survival.
- Repeated visits from one identity behind many sessions become visible.
Care is needed when you interpret the result. Recognition tells you that two visits likely come from the same device, not who the person is. Treat it as a quality signal, such as one device creating many signups, rather than as a verdict on intent. Our returning visitor recognition guide covers how this works in practice, and it works in your customers' favor too, since a known returning customer does not have to prove who they are again.
What do multi-accounting and account sharing look like in traffic reports?
Visitor-level views hide a pattern that account-level views reveal. Multi-accounting means one person or operation running many accounts, often to farm bonuses, free trials or referrals. Account sharing is the reverse: many people using one account, often to avoid paying.
In a traffic quality report, multi-accounting appears as clusters. Many accounts trace back to one device or one identity, signups arrive in tight bursts from one connection, and the accounts share behavior such as identical first actions. Our platform pre-computes patterns across accounts, devices and identities that point to multi-accounting, account farms and account takeover operating behind one connection.
Account sharing looks different. One account shows logins from several unrelated devices and locations over short windows, which inflates seat usage and distorts engagement per user.
Read these patterns with a few rules in mind:
- A household or office can legitimately share a connection, so one IP alone is weak evidence.
- Several accounts on one device identity is stronger evidence than several accounts on one IP.
- Check the timing and the downstream behavior before drawing conclusions.
Our pages on multi-accounting detection and account sharing describe the signals involved. Quality teams benefit because inflated signups and duplicate trials stop counting as growth.
How do you set scoring thresholds that fit your risk tolerance?
A single global cutoff rarely fits. A risk score is useful only when the action attached to it matches the cost of being wrong. Blocking a real customer costs revenue and goodwill, while admitting an abuser costs bonuses, support time or chargebacks. Tolerance for each differs by business.
Think in bands, not a single line. Clean and low-risk visits pass without friction. Medium-risk visits get a lightweight check, such as step-up verification. High-risk visits get the strictest handling, applied by your own code. The step-up authentication guide shows how risk-based verification fits this middle band.
Then tune by use case:
- Marketing analytics: be permissive. You are labeling traffic, not refusing it, so a lower cutoff for "high risk" gives a more honest report.
- Free trial or promo claims: tighten the thresholds, since each abusive signup has a direct cost.
- Payments and account changes: be strictest, and add verification before you refuse.
Tune with data. Sample flagged visits by hand, measure false positives in the medium band, and move a threshold only after reviewing the sample. Because each score arrives with its signals, you can see why a visit landed where it did and adjust with evidence. Our risk signals documentation lists what feeds the score.
What do real traffic quality findings look like in practice?
The following examples are illustrative scenarios, not customer results, and they show the shape of a typical finding.
The paid social campaign that looked cheap. Say a campaign reports plenty of sessions at a low cost per click, yet signups barely move. Splitting by risk band shows most sessions fall in the high-risk band, concentrated on one placement with datacenter ranges and sub-second visits. The action is simple: pause that placement, keep the rest, and re-measure conversion in the clean band.
The free-trial surge. A SaaS team sees trial signups jump, but activation does not follow. Cross-account patterns reveal many trials tied to a small number of device identities. The team adds a verification step for medium-risk signups and keeps the form open to everyone else. Real trial volume looks smaller, but activation rate becomes believable.
The referral source that never converts. An analyst notices a referrer sending steady traffic with near-zero engagement and a blank or spoofed referrer string. A check of velocity and device patterns suggests automation. The source is excluded from reporting, and the team documents the decision for the next audit.
In each case the win came from reading quality by segment, then taking one small, reversible action, which is the workflow described earlier in this guide.
Why auditable signals matter more than a verdict
I have seen teams lose trust in their own dashboards because a tool gave a score and no explanation. When a number cannot be traced to evidence, nobody can defend a decision made on it, and the first disputed campaign erodes confidence in every report.
Auditable signals fix that. When each score arrives with the signals behind it, analysts can check the logic, marketers can challenge a flag, and the decision stays in the customer's own code instead of inside a black box. Persistent identification adds the second half: our platform recognizes returning visitors with up to 99% accuracy, so analysis rests on people rather than disposable cookies. Detection should inform your decisions, never replace them.
— Jeff
Evaluate a signal layer built for traffic quality work
Traffic quality analysis moves faster when every visit arrives already identified and scored. We offer visitor identification, risk scoring and traffic analytics by risk band, with the signals behind every score visible to your team. That makes it quicker to see which channels bring anonymized and high-risk visitors, and easier to defend the decisions you make about them.
- Web integration to start receiving signals.
- A free tier is available to try the service.
- Published plans: Starter at 79 USD per month, Growth at 319 USD per month and Scale at 799 USD per month.
See the plans and pricing and start with the free tier to check your own traffic by risk band.
FAQ
How do you do a traffic analysis?
Pull acquisition data by channel and campaign, compare engagement and conversion for each, then screen for invalid traffic. Document what you flag and what you change, so the next audit builds on it.
How can you analyze your website traffic for free?
Use the predefined traffic acquisition, user acquisition and events reports in Google Analytics. Free tools show your own sessions and channels, while competitor estimates come from separate benchmarking tools.
How does traffic analysis work?
It starts by collecting visit data such as source, behavior and conversion events, then groups it by channel, page and campaign. Analysts compare groups to find which bring engaged visitors and which bring low-quality or invalid activity.
How do you tell invalid traffic from real visitors?
Look for impossible session timing, repeated device fingerprints, bursts of events and unrelated referrers. The IAB and MRC guidance recommends detecting and filtering invalid activity so measurement stays accurate.
Sources
- Iab
- Website Traffic Sources: 7 Types to Look Out For | Mailchimp
- Analytics for marketing specialists and digital analysts | Google Analytics | Google for Developers
Recommended
Related articles
VPN False Positives: 6 SOC Checks Before Escalating an Alert
See why VPN alerts misclassify ordinary traffic, six SOC checks for validation, and why teams need account and device evidence before escalation.

3 Checks to Catch Click Spamming: Detection Playbook for Marketers
Operational playbook for marketers and fraud analysts: three checks, CTIT, conversion baselines and device fingerprints, to detect click spamming early.
How to detect Tor traffic without blocking real users
Detecting Tor traffic is easy because exit nodes are public. The hard part is acting on it without blocking real users. How web detection actually works.
