

Fraud Analytics: Reading Device and Risk Patterns in Web Traffic
Last updated on October 9, 2026 · 9 min read
Last updated: October 9, 2026
Fraud analytics starts with a precise question: which visits, accounts and sources create risk for your product, and what evidence explains it? In its 2025 Internet review, Cloudflare reported that AI bots accounted for an average 4.2% of HTML requests across its measured customer traffic. The report measures “request traffic for HTML content”. That is a request-based figure for a particular network, not your website's fraud rate. The distinction matters whenever a dashboard turns observations into percentages.
For web signup and login, useful fraud analytics connects traffic quality to the accounts and devices behind it. It lets a team move from a source-level change to the individual observations, then check whether the action taken helped. Start with the unit counted, the time range and the outcome you want to improve.
TL;DR: Read identifications, visitors, devices and accounts as different units. Investigate risk changes through named signals and linked activity. Compare channels on a consistent denominator, keep account-event confidence separate from score bands, and join product outcomes before claiming fraud reduction.
Which units should a fraud analytics dashboard count?
A dashboard should state what each total represents. One person can produce many page visits, several identifications and more than one cookie-based visitor. A shared account can have several devices. Treating those totals as interchangeable creates misleading conversion and abuse rates.
| Unit | Useful question | Common mistake |
|---|---|---|
| Identification | How many scored observations occurred? | Calling every check a unique person |
| Visitor | How many device-plus-cookie identities appeared? | Assuming cookie deletion preserves the same visitor |
| Device | Which browser/device contexts returned? | Equating a device identifier with a verified identity |
| User | Which application accounts were active? | Counting unsigned-in traffic as known accounts |
| IP address | Which public network addresses were observed? | Assuming each address belongs to one person |
ShieldLabs derives a Visitor ID from a device and a cookie. Clearing the cookie can change the Visitor ID while the Device ID continues to connect the same browser context. Another browser on the same machine can have a different Device ID. The identifier reference defines these boundaries.
Document your reporting denominator beside the chart. “Users with Multi-accounting / active identified users” means something different from “risky identifications / all identifications.” Neither is automatically a confirmed-fraud rate.
How do you read traffic quality and risk score bands?
Read the distribution before relying on an average. A channel with a small Dangerous group and many Trusted observations can share an average with a channel containing mostly Suspicious observations. Those populations may require different investigations.
ShieldLabs scores identifications from 0 to 100: Trusted 0–29, Suspicious 30–59, Dangerous 60–100. The Overview screen shows traffic quality for the selected domain and period, with counts and shares by band. Its documentation explains how the panels and drilldowns are counted.

Interface illustration from ShieldLabs documentation. The displayed values illustrate the panel; they are not customer results or a benchmark.
Check whether the selection changed before interpreting a spike. A different date range, domain, campaign mix or collection coverage can move the proportions without a change in underlying behavior. Compare equivalent weekday patterns and annotate launches, promotions and integration changes.
A VPN signal can appear on ordinary customer traffic. A Dangerous identification warrants a closer look at its evidence and the sensitive action involved. The score describes detected risk; a subsequent verified business outcome supplies a different kind of evidence. Keep both in your investigation record.
How do you investigate an account event without mixing it with a score?
Account events describe relationships across activity. A Risk Score describes an identification's risk evidence. ShieldLabs reports four High-Risk Events: Multi-accounting, Account sharing, Impossible travel and Account takeover, each with Medium or High confidence. Confidence belongs to the event, not to a fourth score band.
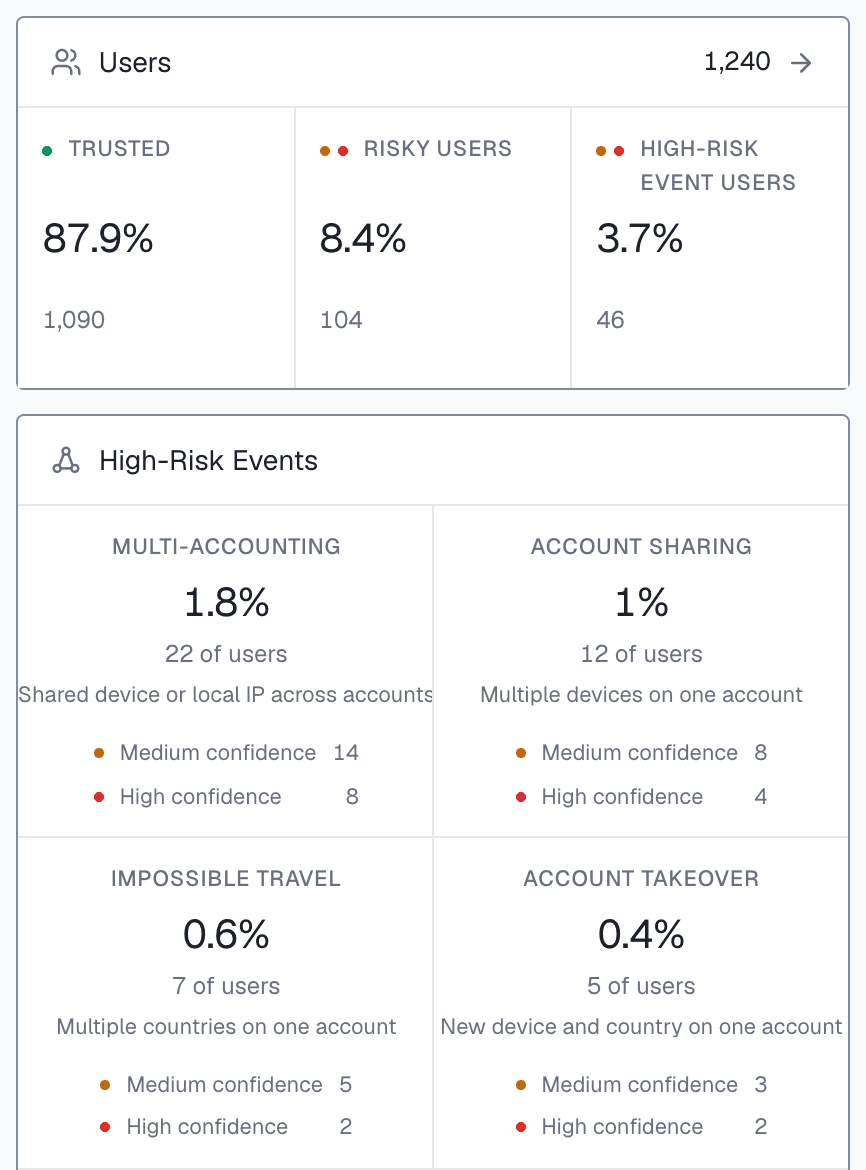
Interface illustration from ShieldLabs documentation, with example values. Event counts are not additive unique-user totals: one user can have more than one event.
Start with the event that changed, open its affected activity, and review the linked users, devices and identifications. For Multi-accounting, check whether the linked accounts are eligible for the benefit they claimed. For Account sharing, examine the device history and account's access policy. An event's confidence helps prioritize the investigation; it does not replace the application's account and entitlement records.
Signed-in activity must include a hashed or pseudonymous User HID. Without it, the dashboard can show traffic and device evidence, but the missing account mapping limits account-level analysis. Verify instrumentation before concluding that a quiet event panel means abuse is absent.
What can source and campaign analysis tell you?
Source analysis tells you where observed traffic came from and what risk evidence accompanied it. Compare channels, referrer domains and campaigns using the same period and units, then drill into the observations responsible for a change. Use volume and a rate together: a high rate from three checks is a weak basis for a budget decision.
The Traffic Analytics reference describes channel attribution, landing URLs and UTM fields. Paid traffic context can help identify campaigns bringing risky visits, but a captured UTM tag alone does not prove a paid click or a verified conversion.
Consider an illustrative weekly comparison: campaign A has 1,000 identifications and campaign B has 40. If each has 10 Dangerous observations, their shares are 1% and 25%. The second rate looks much worse, yet the absolute review workload is equal and the smaller sample is more volatile. Investigate both the observed evidence and subsequent account outcomes before reallocating spend.
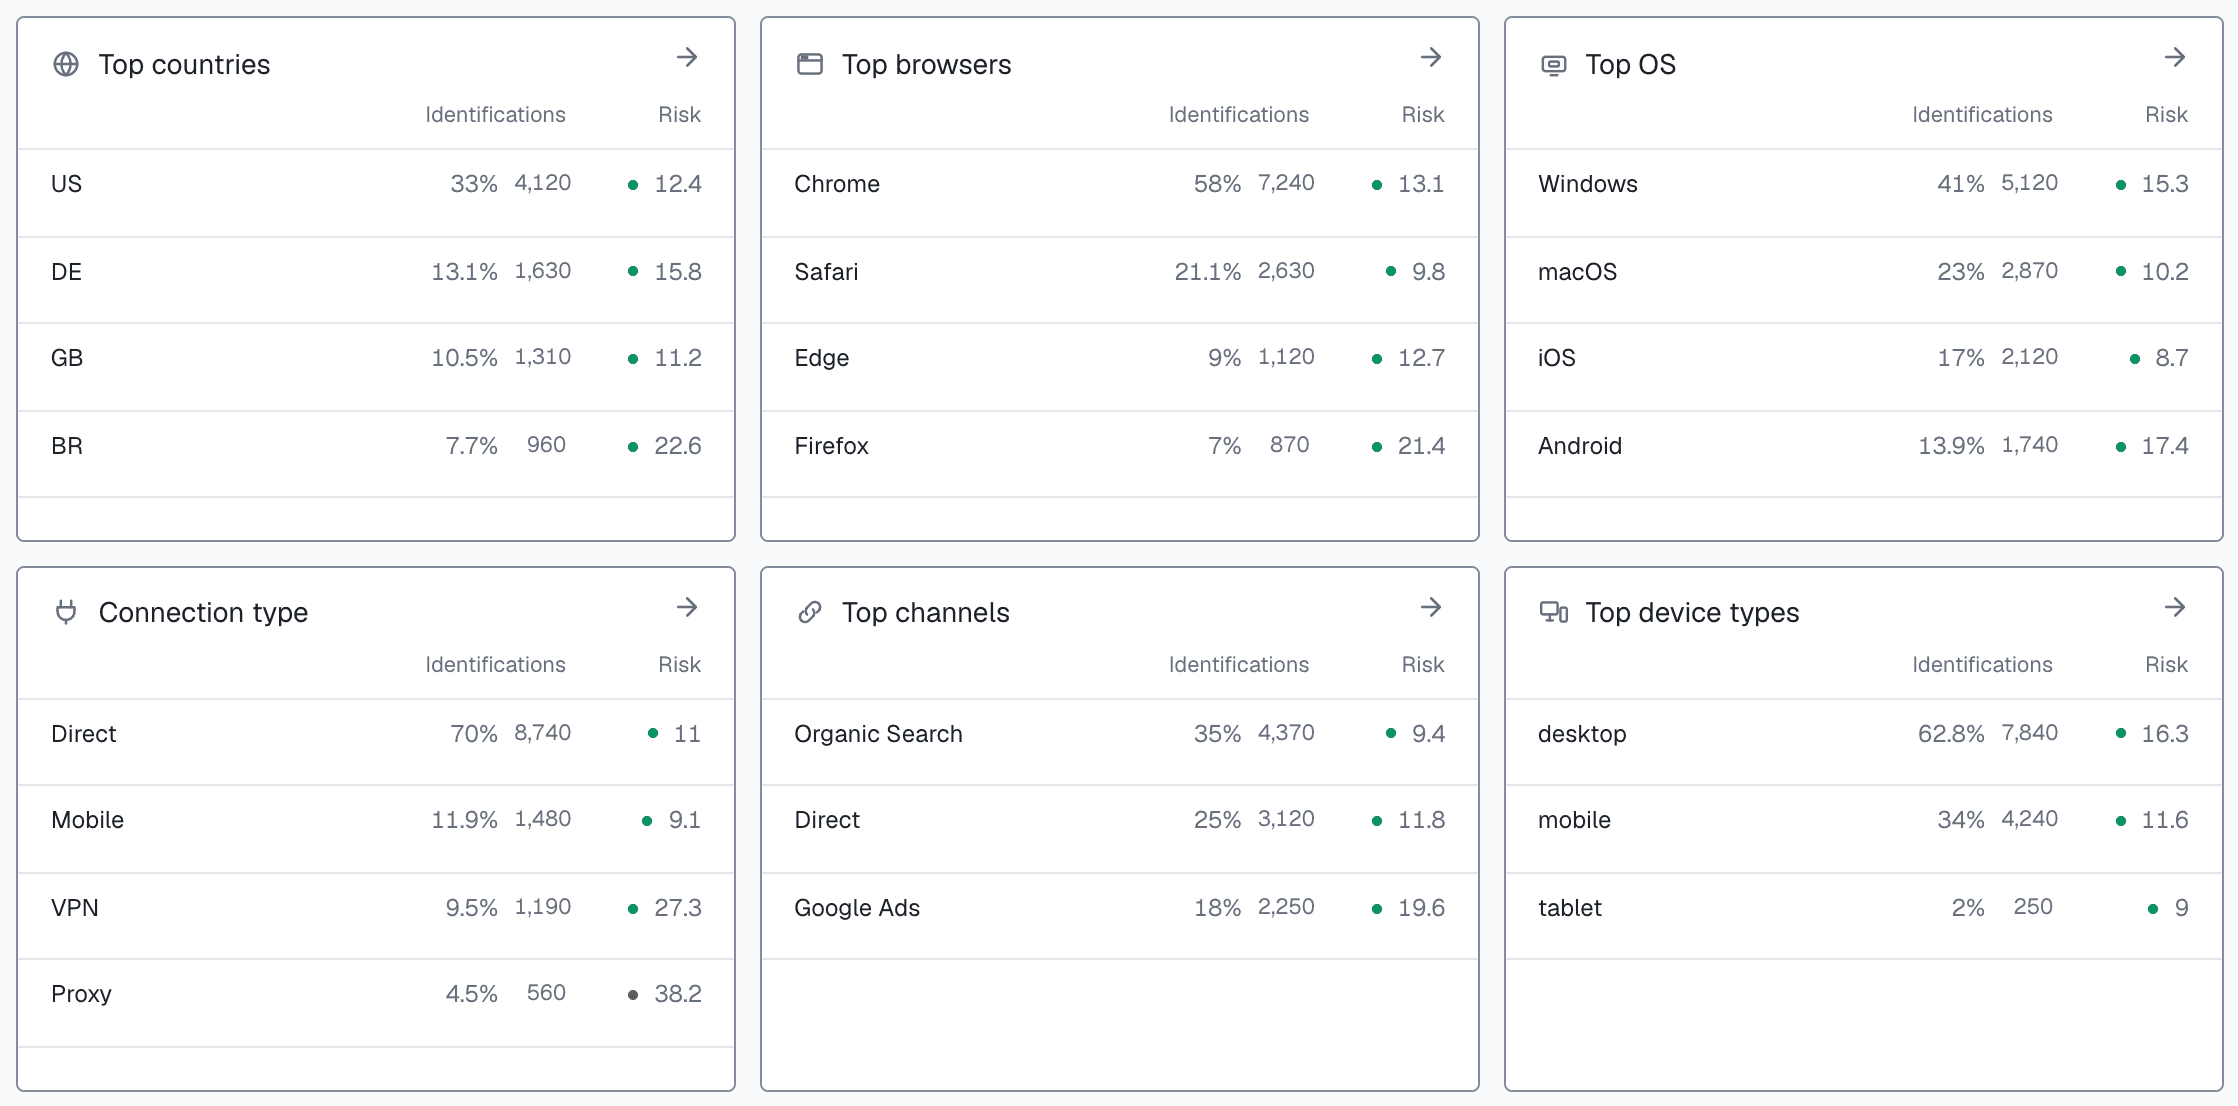
Interface illustration from ShieldLabs documentation. Average risk is a summary of scored identifications, not a payment loss estimate.
Coordinate definitions with your product analytics tool. A pageview in a general analytics system and an identification in ShieldLabs need not occur at the same frequency. Reconcile the collection rules and join keys before presenting their ratio as a funnel conversion rate.
Which risk signals explain a change?
Named signals let a team ask a concrete follow-up question. A rise in Browser Automation suggests a different investigation from a rise in Proxy or Timezone Mismatch. Open the affected identifications and inspect their timing, account linkage, source and available outcomes.
One identification can carry several risk signals. The signal shares therefore do not add up to 100%, and adding their counts can count the same check repeatedly. The risk signal reference describes the detected outputs and how they appear with identification evidence.
Build a weekly review around a small set of comparisons:
- Did the number of identifications change, or only their risk distribution?
- Which named signal explains the largest change?
- Which sources and account groups contributed to it?
- Were the observations complete and collected under comparable conditions?
- What happened to those accounts or actions after review?
Retain evidence for the specific result instead of explaining a score from memory. A fraud detection API integration can store the observation ID alongside a signup or payout. That makes it easier to compare an eventual outcome with the evidence available when the action occurred.
How do you measure whether a response helped?
Join detection records to outcomes from your own product. For signup abuse, relevant outcomes include eligible activation, repeated incentive claims and reviewed abuse. For account access, track successful step-up, access recovery and confirmed compromise. Define when an outcome becomes final and how corrections are recorded.
Report friction alongside the benefit. A lower reward loss can coexist with more legitimate users being held for review. Track challenge completion, review time and confirmed false positives so the team can see that tradeoff. Compare rates within similar cohorts instead of treating a new audience mix as an experiment.
Historical outcomes also have selection bias: if you blocked an action, you may never observe whether it would have converted legitimately. Keep reviewed and unresolved cases separate. A sample of challenged users and approved users helps expose blind spots that a “blocked attempts” total hides.
What should a weekly fraud review produce?
End with an evidence-linked action and an owner. “Investigate campaign B's automated signup cluster” is more useful than “risk increased.” Include the domain and date range, affected account or observation IDs, named signals, event confidence and the next check.
A concise investigation record can contain:
- Observation: which metric changed, with its denominator.
- Evidence: linked identifications and the detected signals or account events.
- Outcome: confirmed abuse, legitimate use, or unresolved.
- Response: verification, access review, pending reward, or another specific product action.
- Follow-up: owner, review date and the metric that will show whether the action helped.
This process gives engineering, growth and operations a shared view of traffic quality. It also separates browser and account evidence from payment transaction analysis. Use payment records and the relevant payment tools when the question involves settlement, chargebacks or financial losses.
Ready to investigate the traffic behind your signups?
ShieldLabs brings identification, named risk signals, four High-Risk Events and traffic quality analytics together for web products. Start Free with 5,000 one-time identifications and review the evidence in your own traffic.
Sources
- Cloudflare 2025 Internet review: HTML request traffic
- ShieldLabs Overview panel definitions
- ShieldLabs identifier model
- ShieldLabs Traffic Analytics
- ShieldLabs risk signals
Recommended
Frequently asked questions
- What is fraud analytics?
- Fraud analytics uses observations and confirmed outcomes to investigate suspicious activity and improve prevention workflows. For web accounts, useful evidence includes device relationships, named risk signals, event timing and benefit qualification. Keep the units, reporting period and unresolved cases explicit when interpreting a rate.
- What are some techniques used in fraud detection?
- Useful techniques include device and account linkage, velocity checks, network risk analysis, qualification checks and review of confirmed outcomes. Their value depends on the action being protected. Shared networks and shared devices can be legitimate, so investigate related evidence before imposing account restrictions.
- How can data analytics be used to detect fraud?
- Compare consistent cohorts, identify unusual activity and follow it to individual observations and account actions. Join those observations to later verified outcomes such as repeated ineligible benefit claims. Track false positives and unresolved cases alongside confirmed abuse so a rise in alerts is not mistaken for better detection.
Related articles
Remember This Device for MFA With a Persistent Device ID
Design remember this device for MFA with a revocable trust credential, persistent device context, expiry and step-up authentication for sensitive actions.

How to Detect AI Agents on a Website
Detect AI agents on a website by separating operator identity, automation evidence and authorization. Protect accounts while permitting useful public crawling.

Fraud Detection API for Web Apps: From Browser Signal to Backend Decision
Integrate a fraud detection API into web signup and login with browser collection, verified server results, signed webhooks and clear timeout handling.